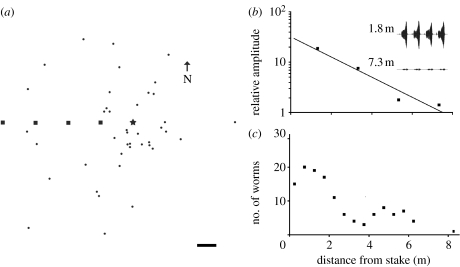
Figure 2.
Distribution of recordings and worm emergence sites. (a) A map indicating the locations of surfaced worms (circles) during a single instance of grunting, geophones in a linear array (squares) and the wooden stake (star). The worm grunter is facing the linear array. Scale bar, 1 m. (b) Relative amplitude decay of vibrations recorded from a linear geophone array (y=42.998 e−0.3066x, R2=0.9406). The inset shows the waveforms of four grunts recorded at 1.83 and 7.32 m. (c) The number of worms surfacing as a function of the distance from the stake. Data are plotted using sliding window comparisons (using 100 cm windows with 50 cm increments).

