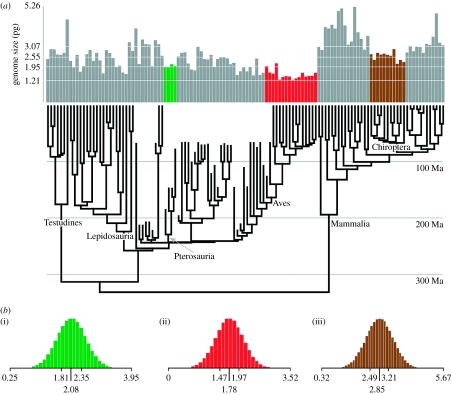
Figure 2.
Genome-size evolution in birds, bats and pterosaurs. (a) Phylogeny and bar graph of average genome size in picograms including the inferred genome size of non-avian dinosaurs, basal archosaurs and pterosaurs (green bars), as well as birds (red bars) and bats (brown bars). Estimates of genome size for extinct dinosaurs are re-estimates of Organ et al. (2007). (b) Posterior distributions of ancestral genome size in picograms for (i) pterosaurs (median=2.08, σ=0.40), (ii) birds (Aves; median=1.72, σ=0.38) and (iii) bats (Chiroptera; median=2.85, σ=0.54). The axes in both panels are labelled with the minimum, 25 per cent quartile, median, 75 per cent quartile, and the maximum of the distributions.

