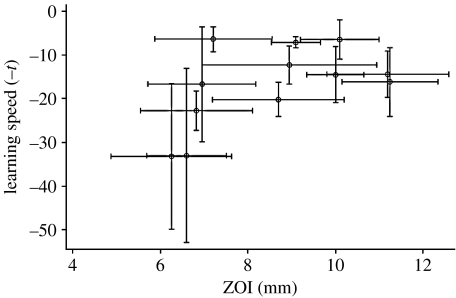
Figure 1.
The relationship between median learning speed (negative t-values) and mean ZOI response of the 12 colonies. As high t-values correspond to slower learning speeds, we have plotted negative t-values to make clear the positive relationship between the colony learning ability and the strength of its immune response. Each point represents a colony. Vertical error bars represent median absolute deviation. Horizontal error bars represent standard error.

