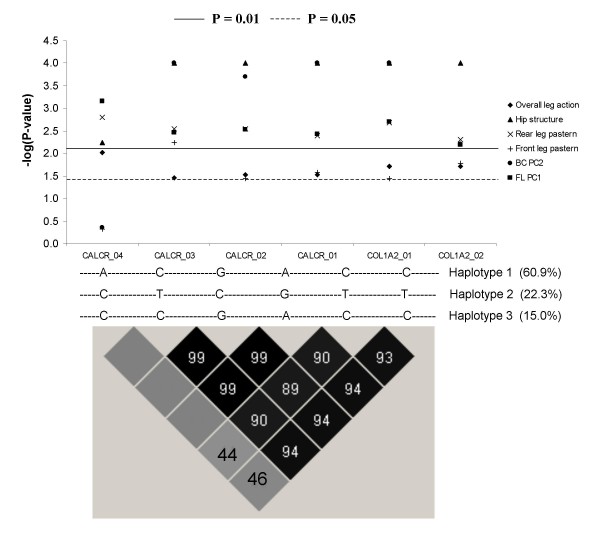
Figure 1.
Association analyses results of single marker and haplotype construction of SNPs within CALCR and COL1A2 in SSC9 (The x-axis indicates SNP ID and y-axis indicates -log (P-value). The dbSNP no. for COL1A2_01, COL1A2_02, CALCR_01, CALCR_02, CALCR_03 and CALCR_04 are ss86352086, ss86352087, ss86352109, ss86352112, ss86352113 and ss86352114, respectively. Black boxes indicate r2 values between 0.9 and 1.0, and light boxes indicate r2 values less than 0.80.)

