Figure 4.
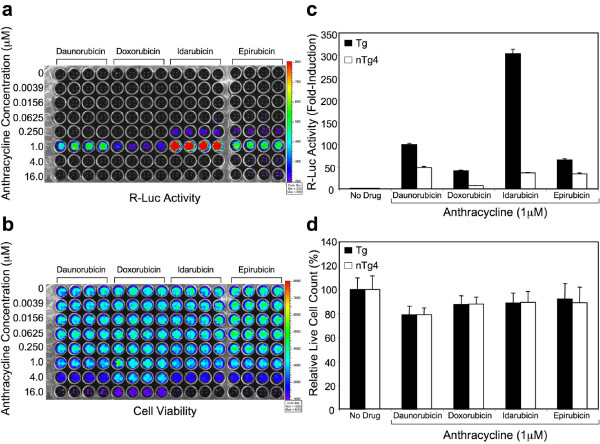
Anthracycline treatment of TNF-α targeted and non-targeted R-Luc reporter cell lines. (a) Dose-response profile of R-Luc activity in the targeted (Tg) cell line treated with four closely related anthracycline antibiotics. Cells treated with Epirubicin were grown on a separate plate. Luciferase activity was assessed using biophotonic imaging on the IVIS. (b) Dose-response profile of cell viability in the Tg line following anthracycline treatment. The same culture plates that are shown in 'a' are also shown in 'b'. Fluorescence was assessed using biophotonic imaging on the IVIS. (c) Relative R-Luc activity in targeted (Tg) and non-targeted (nTg4) cell lines following treatment with a fixed concentration of the different anthracyclines (1 μM). (d) Anthracycline-induced cytotoxicity in the Tg and nTg4 cell lines was similar. Values represent the mean (+/-SEM, N = 4).

