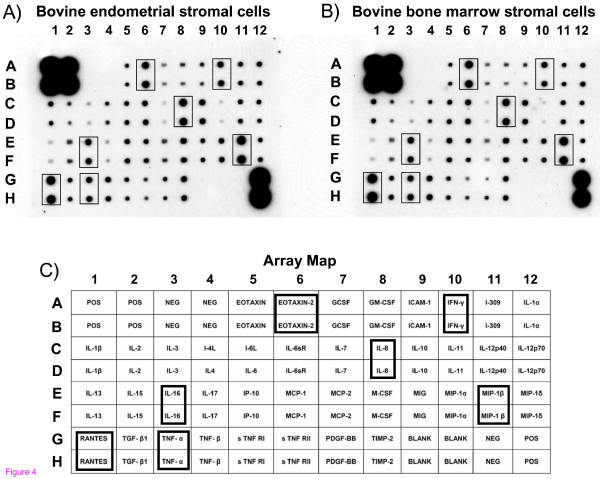
Figure 4.
Patterns of secreted molecules into the sovranatant of bovine endometrial stromal cells (a) and bovine bone marrow stromal cells (B), detected by an antibody Array. C) Map of the specific spotted antibodies in duplicate. Positive, negative and BLANK controls are indicated by POS, NEG and BLANK respectively. Squares indicate over expressed and secreted molecules, where RANTES, MIP-1β, EOTAXIN-2, IL-8, IFN-γ, IL-16 and TNF-α are the most abundant in both cellular types. The test was repeated twice, giving identical results.

