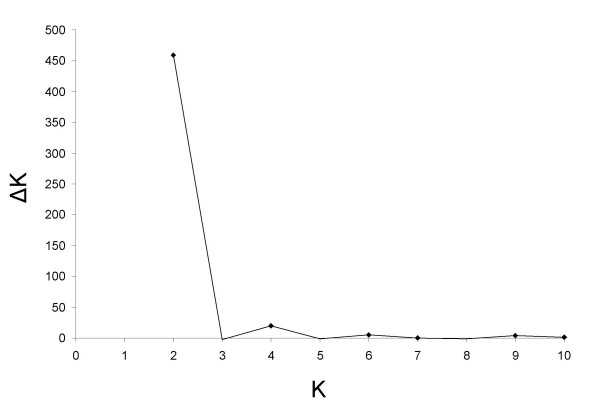
Figure 1.
Determination of Kopt following the method of Evanno et al. (2005). The rate of change of the posterior probability of the data given the number of clusters is plotted against K, the number of clusters. ΔK was calculated as |L"(K)|/s[Pr(x|k)] (see Materials and Methods). The first peak (K = 2) corresponds to the optimum number of clusters. The secondary peak (K = 4) indicates a sublevel clustering.

