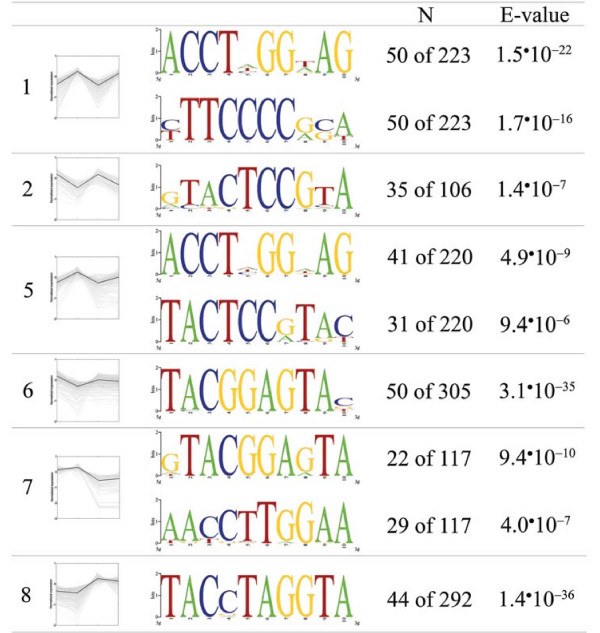
Figure 8.
Predominant motifs identified in 800 nucleotide upstream region. Promoter analysis of the 800 nucleotide upstream region of sets of co-regulated genes, identified by overlapping the results of the four pairwise comparisons (groups 1, 2, 5, 6, 7, 8), using MEME. Motifs with an E-value < 10-5 and without long stretches of A and T (> 40% GC content) were included in the analyses. Consensus sequences were depicted using the web based application WebLogo, version 2.8.2 [86,87]. N denotes the number of genes with the motif compared to the number of genes in the co-regulated group.

