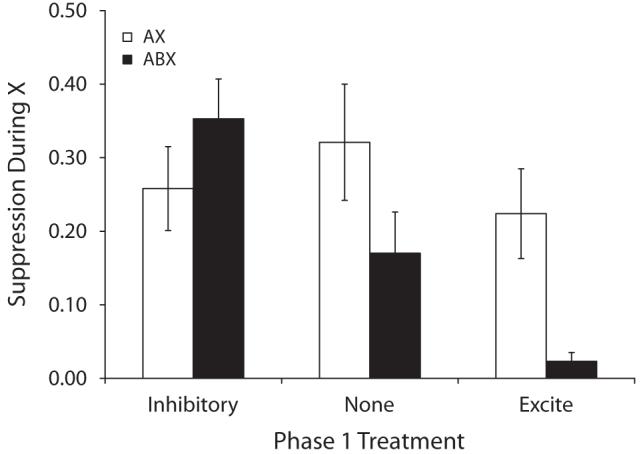
Figure 2.

Group mean suppression ratios in the presence of X in Experiment 2. See Table 2 and the text for details. Lower values indicate stronger suppression and higher values indicate weaker suppression. The brackets represent standard errors of the means. The legend indicates treatment during Phase 3.
