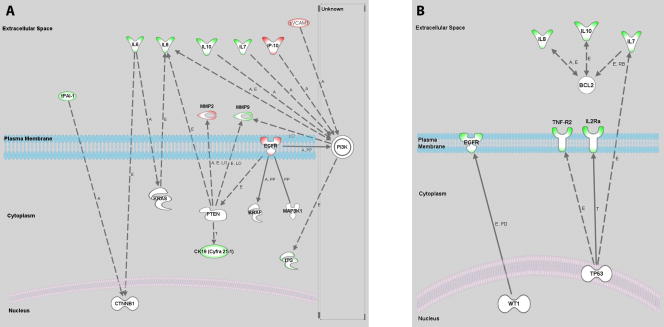
Figure 2. Ingenuity Pathway Analysis of Identified Serum Biomarkers and Reported Molecular Alterations.
The Ingenuity Pathway Analysis software package (Ingenuity Systems Inc., Redwood City, CA) was used to identify relationships between identified serum biomarkers and genetic markers associated with ovarian carcinoma subtypes. A. Interactions identified between CEM carcinoma associated serum biomarkers and the following genes: BRAF, KRAS, CTNNBI, PTEN, MAP3K, and PI3K. B. Interactions identified between serous carcinoma associated serum biomarkers and the following genes: AKT2, APOE2, BCL2, HLA-G, MK167, TP53, and WT1. Biomarker outlines: green - increased in the serum of cancer patients, red – decreased in the serum of cancer patients. Interaction labels: A – activation, E – expression, PD – protein-DNA interaction, T – transcription, PP – protein-protein interaction, LO – localization, RB – regulation of binding, solid line – direct relationship, dashed line – indirect relationship.

