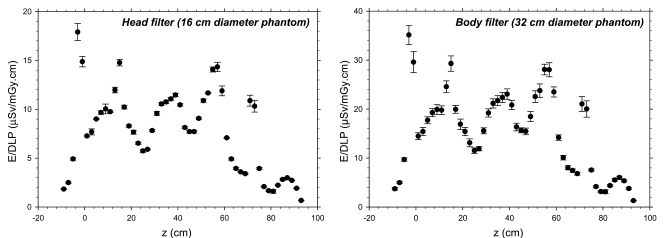
Figure 4:
Graphs of ED/DLP values as a function of z-axis location averaged across four commercial 16-section scanners. Left: Data obtained with head filter and 16-cm-diameter acrylic dosimetry phantom. Right: Data obtained with body filter and 32-cm-diameter acrylic dosimetry phantom. Table 1 lists the locations of radiosensitive organs, which explains the observed peaks. Error bars = standard deviation.

