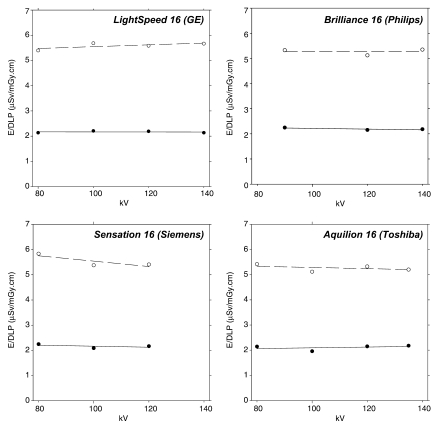
Figure 5:
Graphs of ED/DLP values as a function of x-ray tube voltage obtained with ImPACT software for four commercial 16-section CT scanners (head filter and 16-cm-diameter acrylic dosimetry phantom). Solid circles (solid lines) are head scans, and open circles (dashed lines) are cervical spine scans, with these scans defined in Table 1. Lines are least-square fits to a second-order polynomial.

