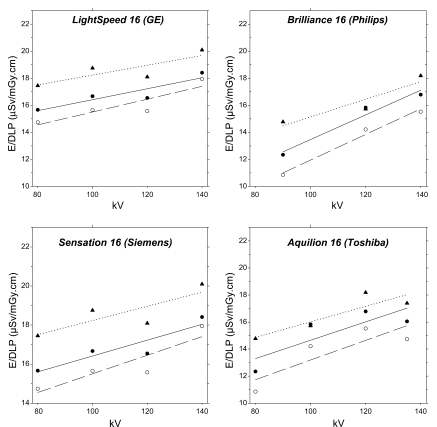
Figure 6:
Graphs of ED/DLP values as a function of x-ray tube voltage obtained with ImPACT software for four commercial 16-section CT scanners (body filter and 32-cm-diameter acrylic dosimetry phantom). Solid circles (solid line) are chest scans, open circles (dashed lines) are abdominal scans, and triangles (dotted lines) are pelvic scans, with these scans defined in Table 1. Each line is obtained from a least-square fit.

