
Figure 1a:
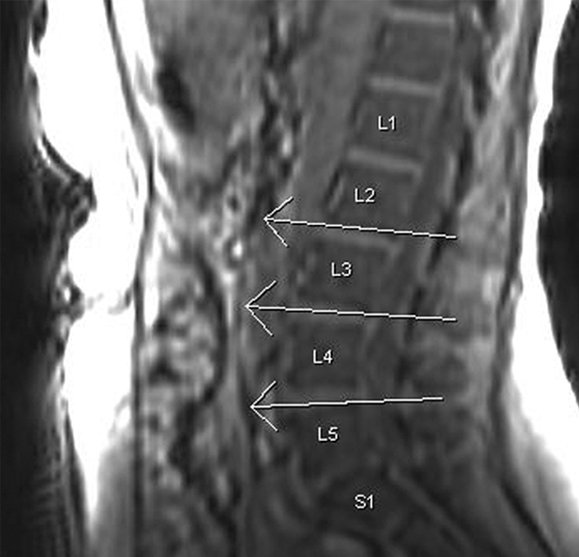
Visceral fat measurement technique. (a) Sagittal T1-weighted localizer MR image used to select levels for analysis (ie, L2-3, L3-4, L4-5). (b) Axial T1-weighted MR image with water suppression at the L2-3 level. Contrast was manually adjusted to select signal from fat (high SI), and ROIs were manually drawn to outline intraperitoneal fat (inside white lines). Area of this fat was calculated by the workstation.