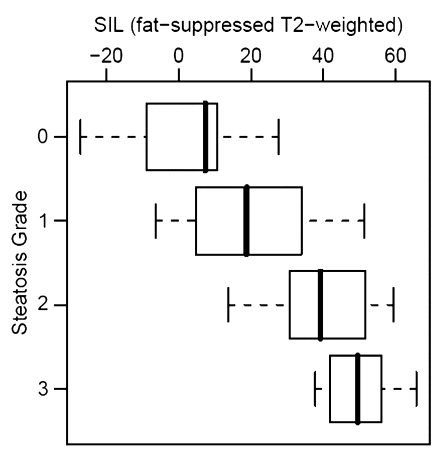
Figure 2b:
Correlation between steatosis grade and (a) relative liver MR SI loss (SIL) on opposed-phase images (ρ = 0.78), (b) relative SI loss on fat-suppressed T2-weighted images (ρ = 0.75), (c) visceral fat area (ρ = 0.77), and (d) BMI (ρ = 0.53). Bold line = median, box = 1st–3rd quartile, dashed line = 95% confidence interval, ○ = outliers.

