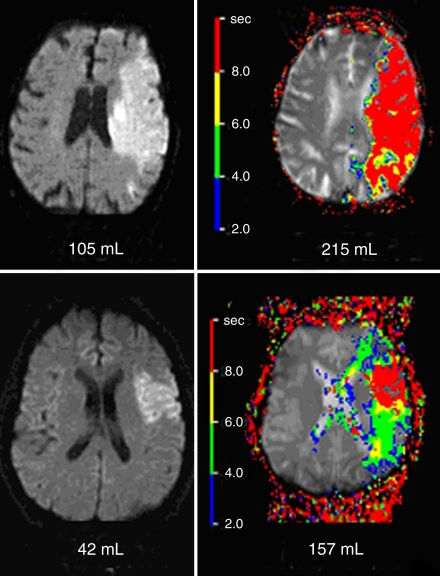
Figure 1:
Example baseline MR images show malignant profile at diffusion-weighted imaging (top left) and perfusion-weighted imaging (top right) and target mismatch profile at diffusion-weighted imaging (bottom left) and perfusion-weighted imaging (bottom right). Color map data shows Tmax delay times in 2-second intervals. The malignant profile was defined as a baseline diffusion-weighted imaging volume of 100 mL or greater and/or a large and severe baseline perfusion abnormality (perfusion-weighted imaging volume with Tmax ≥ 8 seconds, ≥100 mL). The target mismatch profile was defined as a mismatch that did not satisfy the conditions of the malignant profile.

