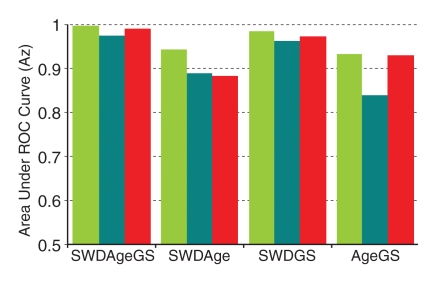
Figure 6:
Bar graph of average performance (as assessed by average Az values) of discrimination indexes in learning set (green), test set (teal), and all 78 subjects by using the fourfold cross-validation method (red). Overall performance of the SWPD-age-GS index (Az = 0.992) fell between the learning set (Az = 0.997) and the test set (Az = 0.974). SWD = SWPD.

