
Fig. 4.
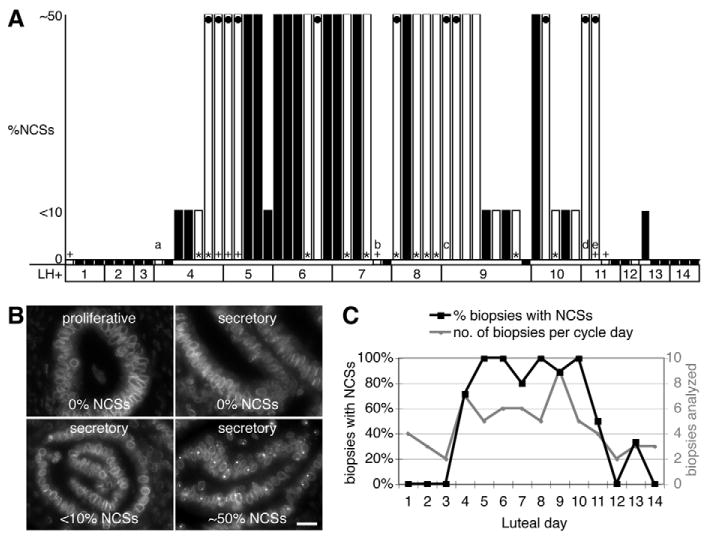
The NCS marks the implantation window. (A) Histogram of 64 human endometrial biopsies collected on the indicated luteal days (LH+) and scored for the percentage of epithelial cell nuclei containing NCSs using three categories, none (0%), less than 10% (<10%), and between 10% and 60% but mostly around 50% (∼50%). Where available, the luteal day was determined in the following order of priority, according to LH surge, classical histological criteria (+) (Noyes et al., 1950), and chronological day (*). Some biopsies from conditions that may affect dating are indicated: (a) fibroid uterus; (b) menopause transition treated with hyper estrogen and hypo progesterone; (c) 30-34 day cycle; (d) 34-37 day cycle; (e) dysmenorrhea. The biopsies in which NCSs were quantified more accurately (Table 1) are marked (black dots). (B) Representative mAb414 fluorescence micrographs for each category in (A) including a proliferative biopsy. Scale bar: 20 μm. (C) Summary of the data in A expressed as a percentage of biopsies on each luteal day containing NCSs (black squares, left y-axis) and the number of biopsies analyzed on each day (gray circles, right y-axis). Note that only on luteal days 4-10 did over 70% of biopsies contain NCSs.