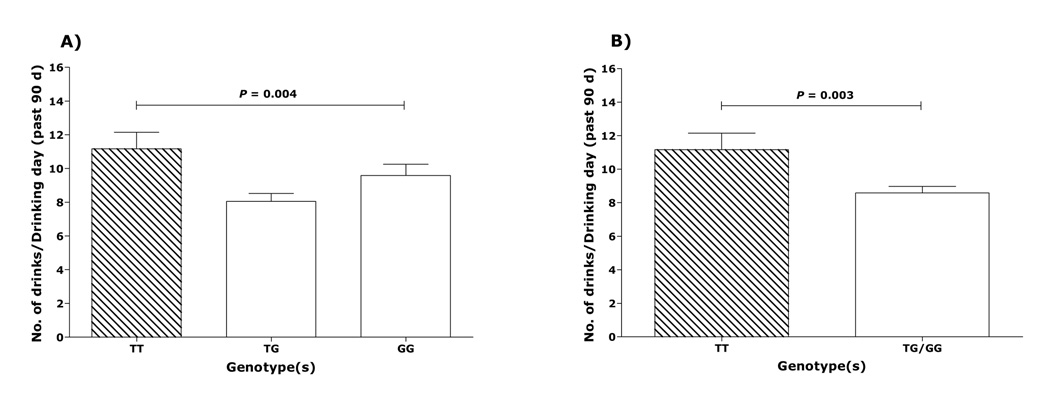
Figure 2.
Amounts of drinking in 165 Caucasian male and female alcoholics. (A) Amounts of drinking as a function of TT, TG and GG genotypes of rs1042173 (N of subjects in each group is: 47 TT, 77 TG, and 41 GG). Mean drinks per drinking day (± SEM) for the TT, TG and GG subjects were 11.17 ± 0.98 vs. 8.05 ± 0.47 and 9.58 ± 0.67, respectively (F=5.63; p=0.004).(B) Drinks per drinking day variance as a function of the TT and G carriers (N of subjects in each genotype is: 47 TT, 118 G carriers). Mean drinks per drinking day (± SEM) for the T homozygotes and G carriers were 11.17±0.98 vs. 8.58±0.39 respectively (t=2.97; p= 0.003).

