
Figure 5.
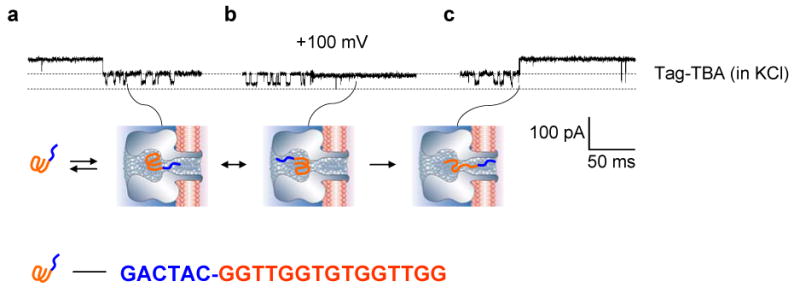
Current traces from single αHL pores showing blocks with Tag-TBA. The DNA concentration and the solution condition were the same as in Fig.2. a. Characteristic blocks produced by tag-TBA (top) and the model showing the molecular location and position in the cavity (bottom). b. Another type of block by tag-TBA (top) and the corresponding model showing the change in position of the molecule (bottom). c. Unfolding of tag-TBA in nanocavity (top) and the model of this process (bottom).