
Figure 12.2.
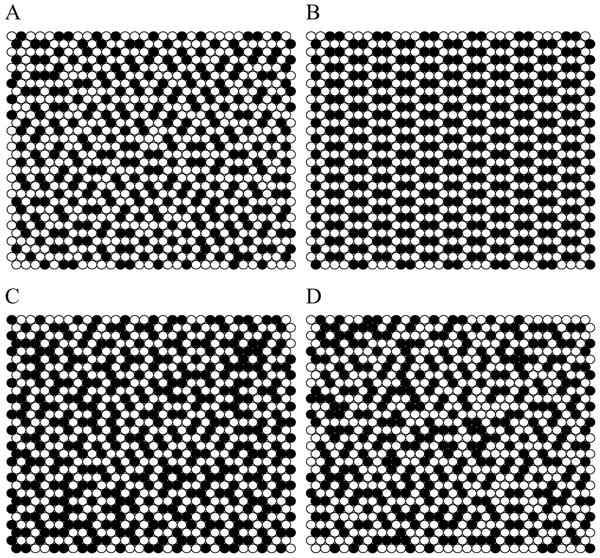
Snapshots of phospholipid and cholesterol lateral distribution simulated using MIEP II. (A) χchol = 0.51 and ΔEC = 0.5 kT; (B) χchol = 0.57 and ΔEC = 0.5 kT. Cholesterols form an aligned dimer pattern; (C) χchol = 0.62 and ΔEC = 0.5 kT; (D) χchol = 0.57 and ΔEC = 0.2 kT. Filled circles: cholesterol. Open circles: Acyl chains of PC.