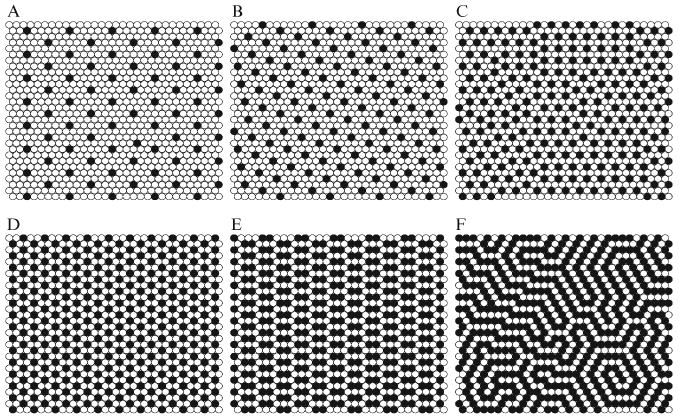
Figure 12.4.

Six regular distributions of cholesterol that have been successfully simulated using MC simulation based on the umbrella model. Black circles: cholesterol. Open circles: acyl chains of PC. (A) χchol = 0.154; (B) χchol = 0.25; (C) χchol = 0.40; (D) The “monomer” pattern at χchol = 0.50; (E) The dimer pattern at χchol = 0.571; (F) The “maze” pattern at χchol = 0.667, which is the maximum solubility limit of cholesterol in PC.
