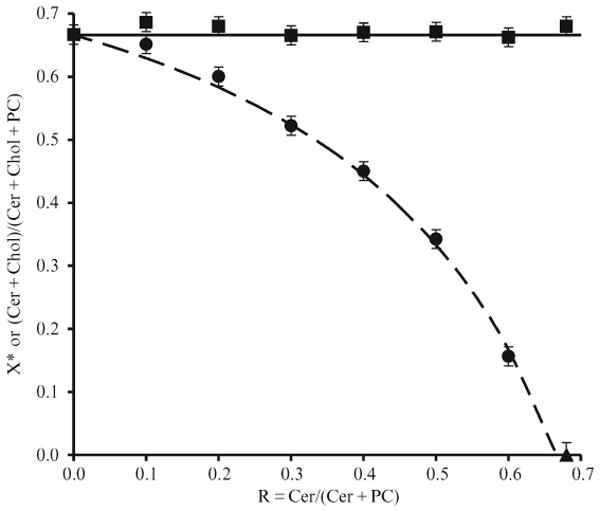
Figure 12.7.

The maximum solubility of cholesterol, , or the ratio (ceramide+choleserol)/(ceramide+cholesterol+PC) as a function of ceramide/(ceramide+POPC) ratio. Circles: , measured by COD activity assay. Triangle: The maximum solubility of ceramide in POPC bilayers determined by optical microscopy measurement. The dashed line is the theoretical curve with the assumption that one ceramide molecule displaces one cholesterol from the bilayer phase into the cholesterol crystal phase. Squares: the ratio (ceramide+choleserol)/(ceramide+cholesterol+PC) at the cholesterol solubility limits.
