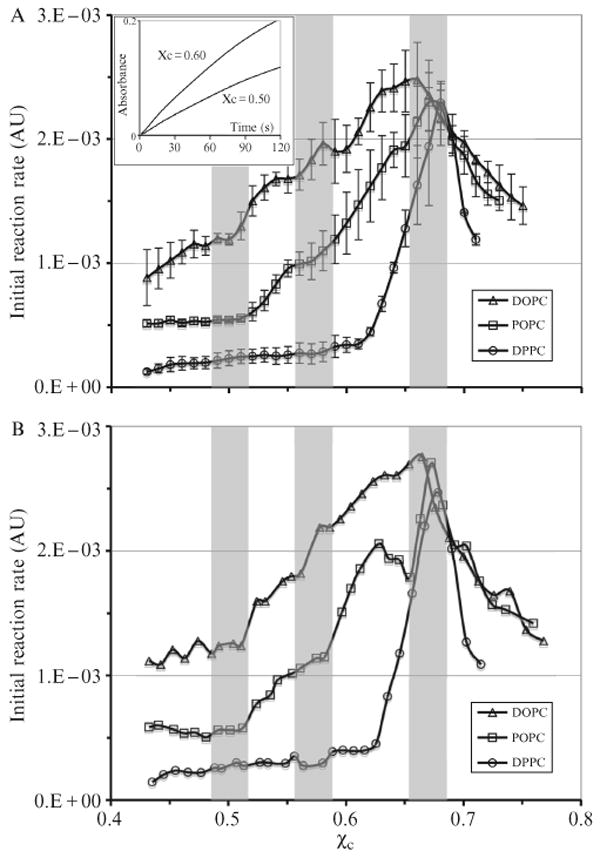
Figure 12.9.

COD initial reaction rate as a function of cholesterol mole fraction in the high-cholesterol region. The shaded bars indicate the locations of expected jumps at 0.50 and 0.571 and the cholesterol maximum solubility limit at 0.667 predicted from the MC simulations based on the umbrella model. The width of the bars reflects the experimental uncertainty in χchol in our samples (±0.015) (A) Average curves, each obtained from three independent sample sets. (B) Individual curves. The jumps at 0.5 and 0.57 appear sharper. Inset: COD reaction progress curves of DOPC/cholesterol mixtures. The reaction rate is higher at χchol = 0.60 than that at 0.50. From Ali et al. (2007), with permission.
