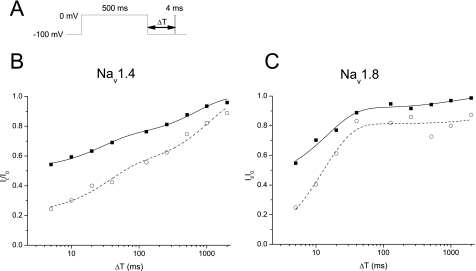
FIGURE 6.
Slowed and suppressed recovery from inactivation by CTX3C. A, pulse protocol with variable intervals (ΔT) between the conditioning pulse and the test pulse. Representative recovery data from Nav1.4 (B) and Nav1.8 (C) are shown. The duration of the conditioning depolarization was set to 500 ms. The recovered INa values evoked by the test pulse (It) relative to those without the conditioning pulse (I0) were plotted against the interpulse intervals in milliseconds (Δt in the axis). The recovery time courses were fitted by the sum of two exponentials as follows: (It/I0) = A1τ1·exp(–(t/τ1) + A2τ2·exp(–(t/τ2) + C. See Table 3 for the fitted parameters. Nav1.8 recovered slightly faster than Nav1.4. However, the slower time constants for Nav1.8 tended to be larger than that of Nav1.4.

