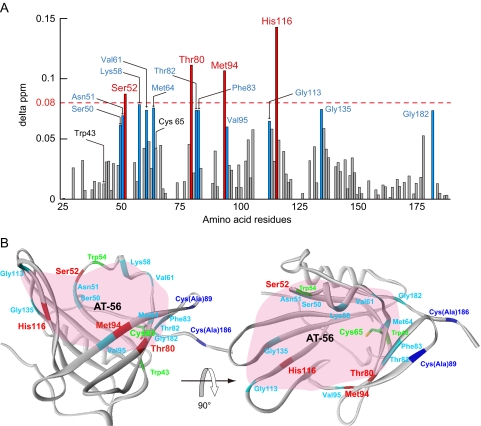
FIGURE 3.
Interactions of L-PGDS with AT-56 as examined by NMR. A, composite 1H and 15N chemical shift differences (delta ppm) versus the amino acid sequence of recombinant mouse L-PGDS C89A/C186A mutant. B, overall structure of L-PGDS after AT-56 binding in a ribbon representation. In both panels, the residues with relatively large changes in chemical shift (≥0.08) are represented in red, whereas residues with shifts in the middle range (0.06 ≤ Δ ppm < 0.08) are shown in sky blue. In B, the AT-56-binding site predicted from NMR signal perturbation is shaded in pink.

