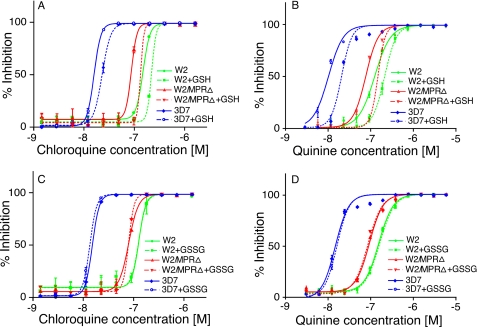
FIGURE 5.
Changes in responses to CQ and QN at the presence of exogenous GSH (2.5 mm) and GSSG (5.0 mm). A and C, response to CQ. B and D, response to QN. The parasite groups used are as indicated in the figures. The data presented were averages from three independent repeats. The graphs were plotted using a nonlinear regression model in GraphPad Prism 5 (La Jolla, CA) with constraint at the top of the graphs but no constraint at the bottom.

