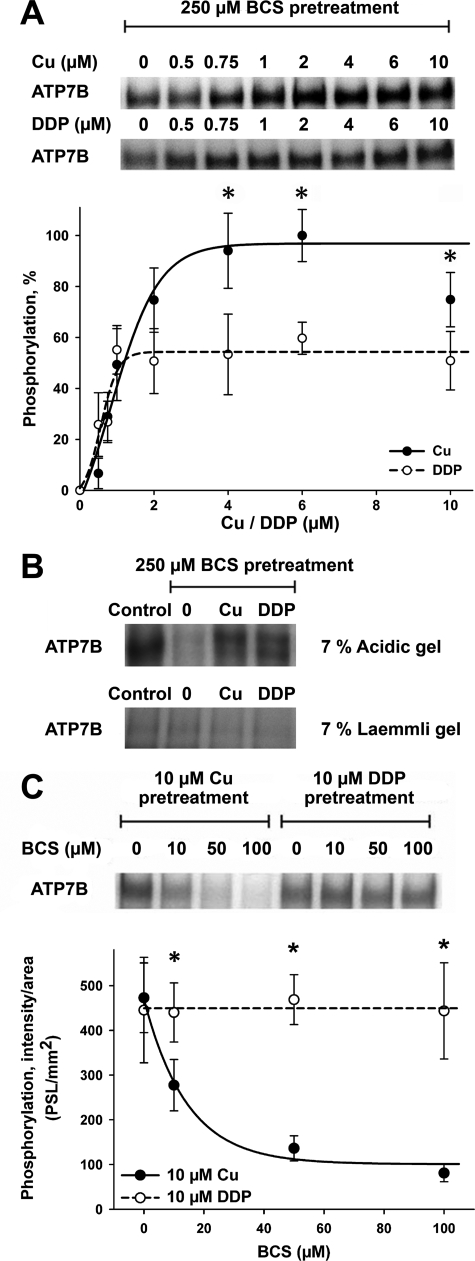
FIGURE 5.
The effects of copper and DDP on catalytic phosphorylation of ATP7B. A, catalytic activity of ATP7B was first inhibited by incubation with 250 μm BCS. Copper (•) or DDP (○) was then added to ATP7B, and reactivation of catalytic phosphorylation was measured as described under “Experimental Procedures.” The upper panel shows 32P autoradiograms of a representative gel, and the lower panel shows quantification of phosphorylation by densitometry. The phosphorylation level of ATP7B prior to BCS pretreatment was set to 100%. The quantification data show the means ± S.D. of five independent experiments. The curves were fitted with a sigmoidal model. *, p < 0.05. B, ATP7B was phosphorylated as in A; the phosphorylation of ATP7B without any treatments represents the control. The upper panel shows phosphorylation visualized at acidic pH (acidic gel). Phosphorylation is largely absent on a regular Laemmli gel (lower panel). The faint phosphorylation band represents a kinase-induced phosphorylation on serine residues of ATP7B normally found in Sf9 cells. C, ATP7B was phosphorylated as in A using 10 μm copper (•) or DDP (○) in the presence of increasing concentrations of BCS (10–100 μm). The upper panel shows an autoradiogram of a typical gel. The lower panel shows quantification data (means ± S.D.) of four separate experiments. The curves were fitted with a single exponential decay model (*, p < 0.05; *, p < 0.01 when comparing copper and DDP treatments).

