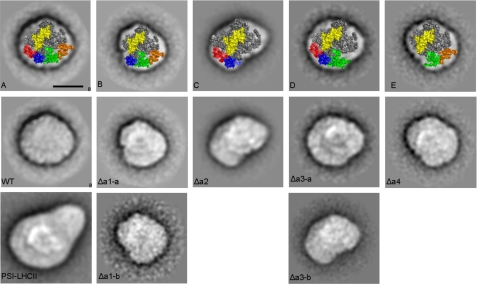
FIGURE 5.
Electron microscopy analysis of PSI with different LHCI compositions. Fig. A–E are top views of the crystal structure (1) overlaying the projections of PSI-LHCI (A), PSI lacking Lhca1 (B), PSI lacking the Lhca2/3 dimer (C), PSI lacking Lhca3 (D), and PSI lacking the Lhca1/4 dimer (E). PsaC and PsaE are presented in yellow, Lhca1 in red, Lhca2 in green, Lhca3 in orange, and Lhca4 in blue. All projections are viewed from the stromal side. Averaged images of PSI from WT, Δa1-Δa4 plants are presented, and, for comparison, a PSI-LHCII complex (37). Images are sums of 765 (WT), 768 (WT PSI-LHCII), 775 (Δa1-a), 64 (Δa1-b), 1317 (Δa2), 212 (Δa3-a), 217 (Δa3-b), and 648 (Δa4) aligned projections. The scale bar equals 10 nm.

