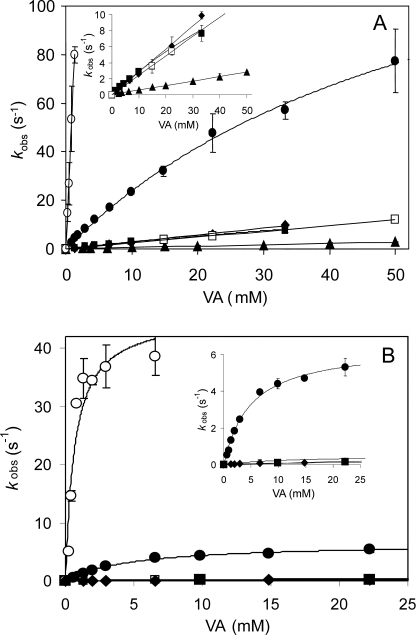
FIGURE 4.
Kinetics of reduction of VPI and VPII of native VP and its directed variants by VA. Stopped-flow reactions were carried out at 25 °C using 1 μm enzyme, 0.1 m tartrate (pH 3), and varying concentrations of VA. The insets show kinetic curves at a smaller vertical scale. Means and 95% confidence limits of replicate assays are shown. The symbols are as follows: native VP (•), W164Y (▪), W164H (♦), W164S (▴), W164Y/R257A/A260F (□), and R257A/A260F (○).

