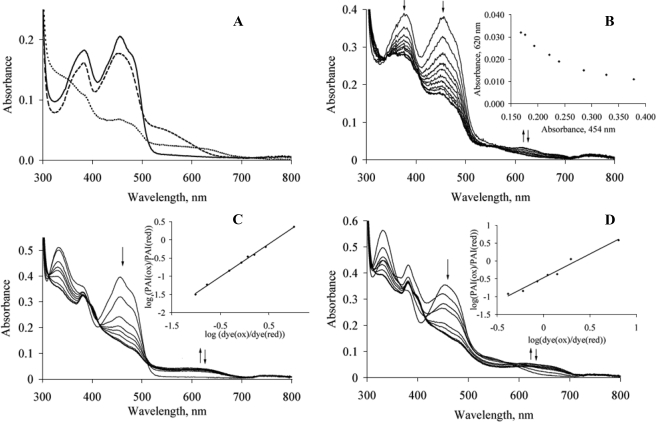
FIGURE 3.
A, substrate complex formation. Bold line, PAI; dashed line, PAI upon 10× excess of LA; dotted line, photoreduced PAI, semiquinone. B, photoreduction of PAI. The arrows indicate absorbance changes at 380, 454, and 620 nm. On the inset, plot of absorbance changes at 620 versus 450 nm shows that no decay of reduced FAD species occurs upon extensive photoreduction. C, determination of PAI midpoint potential. Protein was photoreduced in the presence of reference dye, anthraquinone-2-sulfonate. The arrows indicate absorbance changes during the reduction. Insets, changes of redox states for the dye and protein plotted according to Minnaert (21). D, same as C, but for the PAI-(10E,12Z)-CLA complex.

