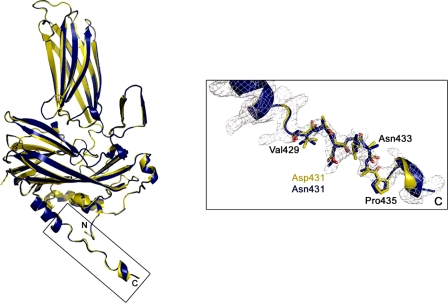
FIGURE 5.
Structure of the VP2 D431N T = 1 SVP monomer. Ribbon diagrams of wild-type (yellow) and mutant D431N (blue) VP2 proteins. The superposition was performed using all the 428 residues of both molecules. Shown on the right is an electron density map of the VP2 C-terminal boxed region around residue Asp-431. Residues from Val-429 to Pro-435 are shown as sticks and explicitly labeled every two residues.

