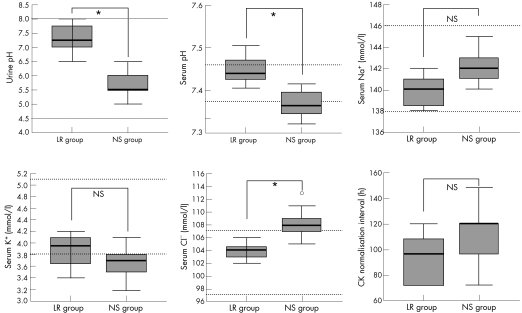
Figure 2 Urine and serum pH, serum Na+, K+ and Cl− levels after 12 h hydration, and the interval to CK normalisation in the group receiving 0.9% saline (NS) and that receiving lactated Ringer (LR) solution. Data are displayed as a box and whisker plot. The bottom of the box represents the 1st quartile, and the top represents the 3rd quartile. The thick line in the box represents the median. The horizontal lines at both ends of the box represent the highest and lowest values observed. The horizontal dotted lines (……) represent the reference ranges. *p<0.05; o, outlier; NS, not significant.

An official website of the United States government
Here's how you know
Official websites use .gov
A
.gov website belongs to an official
government organization in the United States.
Secure .gov websites use HTTPS
A lock (
) or https:// means you've safely
connected to the .gov website. Share sensitive
information only on official, secure websites.
