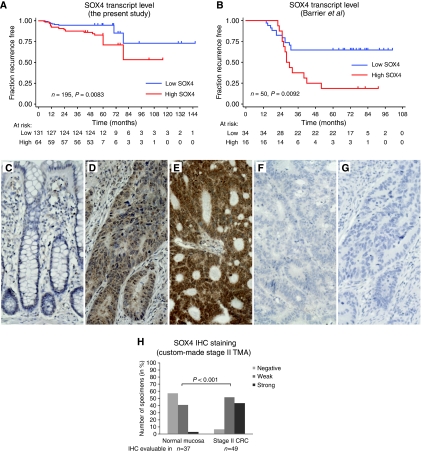
Figure 2.
Analysis of SOX4 transcript and protein expression levels. Shown are censored Kaplan–Meier curves for recurrence-free survival of MSS stage II CRC according to the transcriptional expression level of SOX4 as measured by microarray expression profiling in this study (A) and the study by Barrier et al (2006) (B). The P-values correspond to the log-rank test. To investigate whether the SOX4 protein expression level changed from normal mucosa to adenocarcinoma, IHC was applied to a custom-made stage II TMA. The TMA tissue cores were not scored if they were missing, or contained fewer than 10 cancer cells, or demonstrated significant tissue or IHC staining artefacts. Hence, only 49 of the 51 adenocarcinoma and 37 of the 49 normal mucosa cores in the TMA were scored. In the majority of the normal mucosa samples, SOX4 was either not (C) or only weakly expressed. By contrast, a strong SOX4 staining was observed in more than 40% of the stage II adenocarcinomas. Often, the SOX4 protein was localised both in the cytoplasm and in the nucleus of the cancer cells. In some adenocarcinomas, the SOX4 staining was strongest in the nucleus (D), whereas in others, the cytoplasm and the nucleus were stained equally strong (E). Adenocarcinomas with no SOX4 staining (negative) were also observed, though only rarely (F). These were highly similar to the ‘no primary’ antibody negative control (G). The distribution of SOX4 IHC scores (combined nuclear and cytoplasmic staining) showed that both the frequency and the intensity of SOX4 staining were increased in the adenocarcinomas compared with those in the normal mucosas (H). The same was the case when the nuclear and cytoplasmic IHC scores were analysed individually (data not shown). The P-values were calculated using the χ2 test. All IHC images are × 20. Staining: brown, SOX4; blue, haematoxylin counterstain.

