
Figure 11.
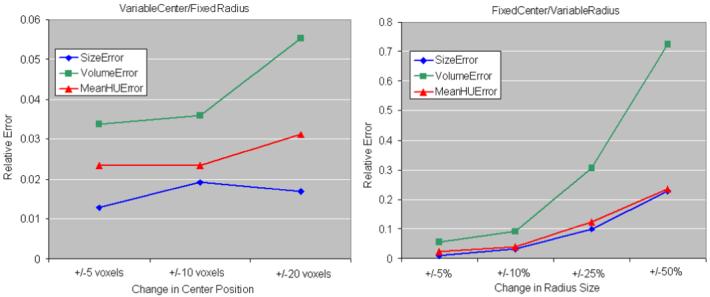
Seed point variation. The errors in size, volume and enhancement estimations are presented, relative to the best segmentation. The chart on the left shows the relative errors when the center seed point is moved with 5, 10 and 20 voxels, without changing the manual estimation of the tumor radius. On the right, the manual radius estimate is varied with 5, 10, 25 and 50% of the maximum tumor radius, without changing the central point.