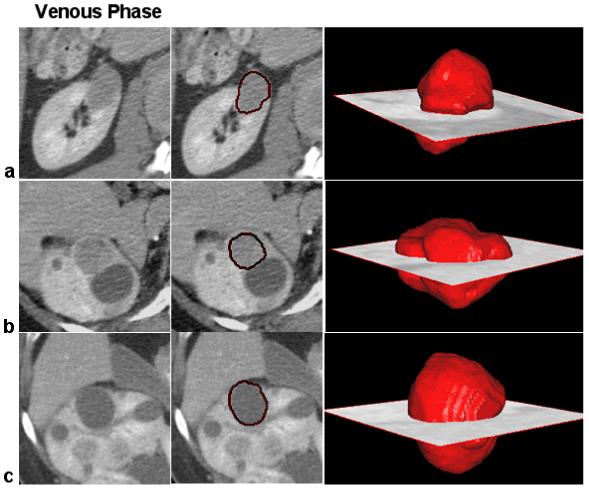
Figure 8.

Examples of 3D segmentation of renal lesions. Row (a) shows the segmentation of an HPRC lesion; on row (b) we present a VHL cancer; and on row (c) a benign cyst. Near 2D slices from the 3D CT volumes, we present the segmentation results using our method for renal tumor segmentation and quantification. The 3D volumes of the segmented lesions are overlaid on the CT scan at the location of the tumor.
