
Figure 9.
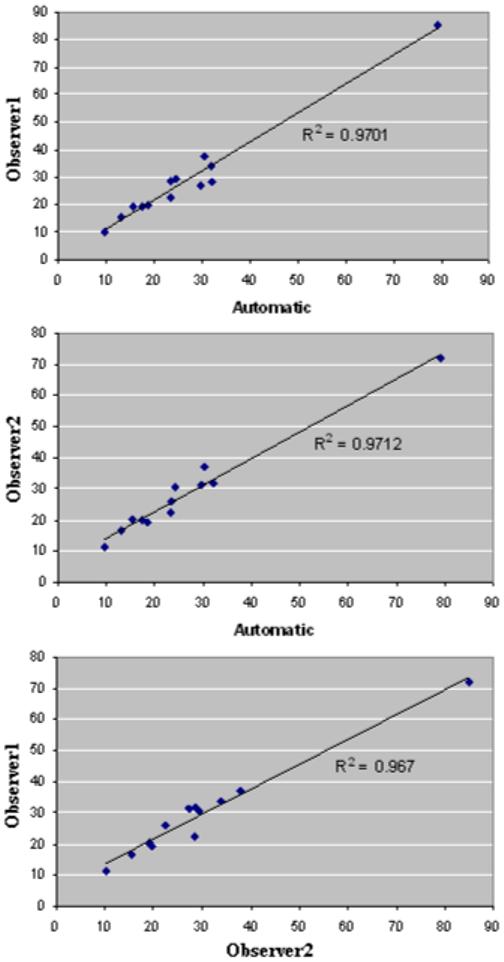
The best linear fits for correlated measurement results between the automated method and the two sets of 3D manual measures. From top to bottom, the charts show correlated data corresponding to the largest size of the segmented lesions. R-squared measures confirm that the variability between the automated method results and those of observers are in the same range as inter-radiologist variability.