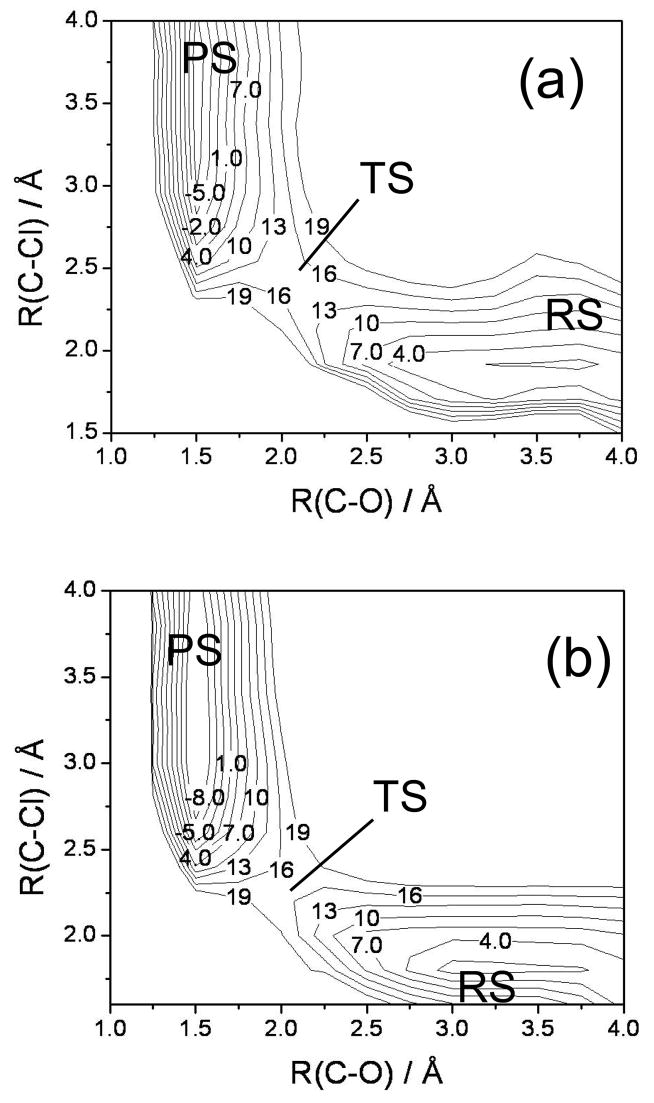
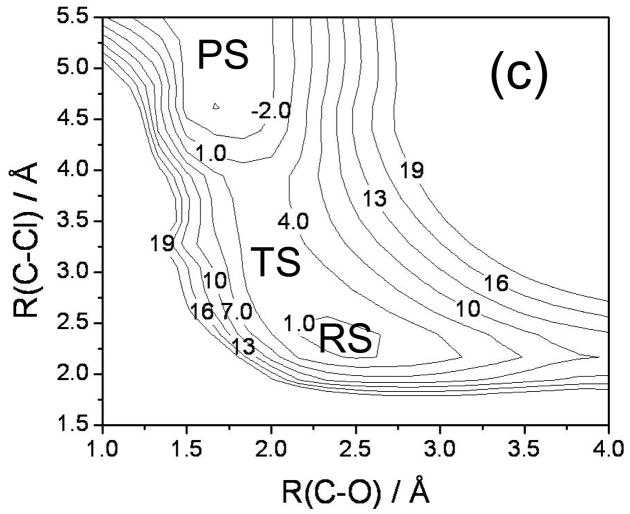
FIG. 5.
Contour plots of the ground-state adiabatic potential surface in the plane of the O-C and C-Cl distances. The levels of calculation used to construct the plots are (a) B3LYP, (b) M06-2X, and (c) EVB. “RS”, “TS”, and “PS” stand for the reactant ion-molecule complex, the transition state, and the product ion-molecule complex, respectively. Note the different ordinate between parts (a) and (b). The energy units used are kcal/mol.


