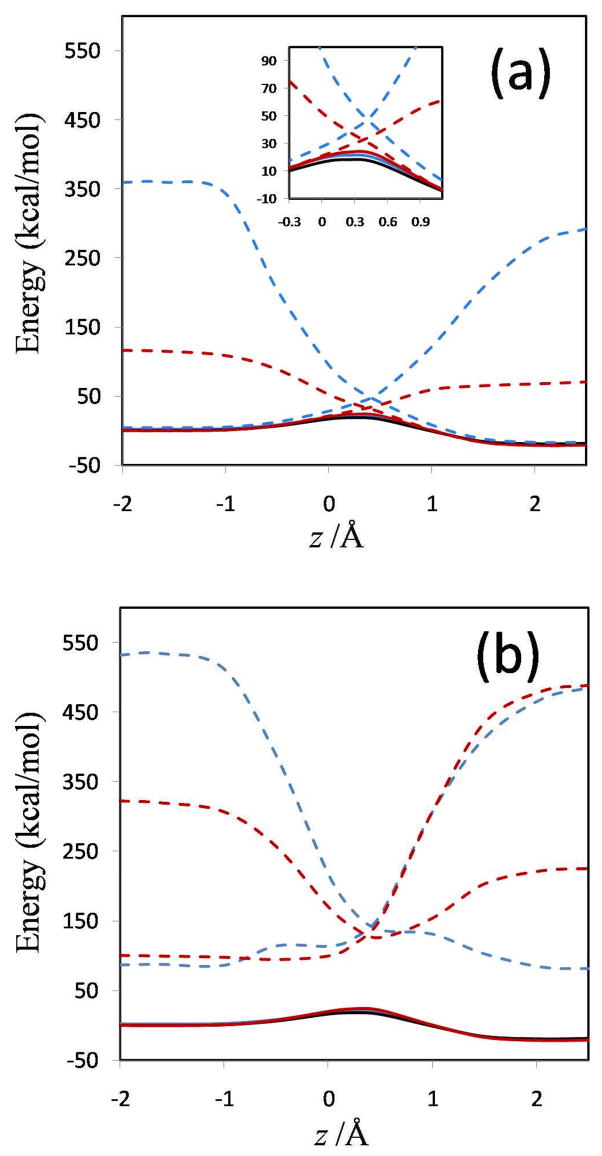
FIG. 6.
Comparison of adiabatic and diabatic potential profiles. (a) Adiabatic HF profile (black line) and adiabatic and diabatic MOVB potential energy profiles obtained by nonorthogonal VDC (red lines) and nonorthogonal CDC (blue lines) schemes. The panel in the center is a blowup of the central region of the larger panel. (b) Same as part (a) except MOVB results are in the orthogonal representation. In both (a) and (b) the zero of energy is chosen as the ground-state HF adiabatic energy of the ion-molecule reactant complex.

