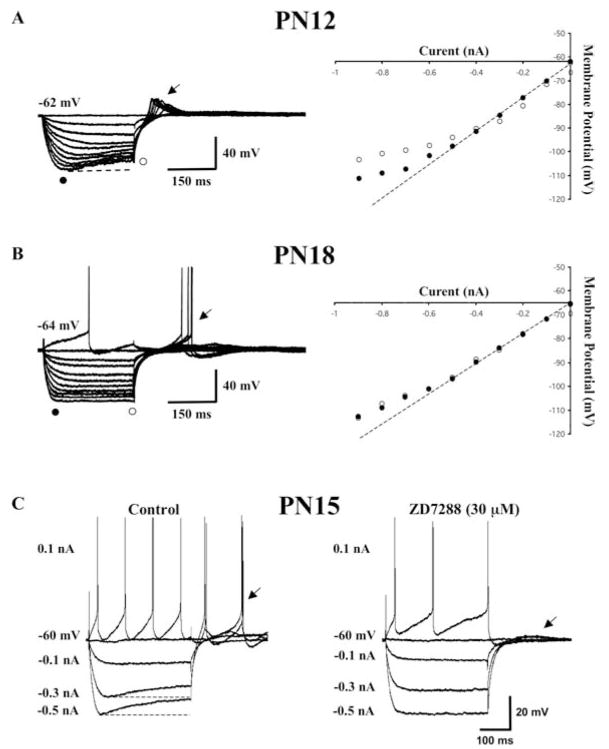
Fig. 4. Non-linearity in the current-voltage (I–V) relationship of Pf cells.
(A) Representative current-clamp recordings from a PN 12 Pf neuron in response to a series of hyperpolarizing current pulses (0.1–0.9 nA). This cell exhibited a prominent hyperpolarization-activated (Ih) current reflected as a depolarizing ‘sag’ in the membrane potential (left side). The voltage-dependence of Ih is reflected by the difference between the peak (solid circle) and plateau (open circle), I–V plots for this cell are shown on the right. (B) Representative recordings from a PN 18 Pf cell that lacked an Ih current (left side). Note the absence of any difference in the peak and plateau, which is reflected in the I–V plot on the right side. The cells in A and B have a non-Ih inward membrane rectification reflected by the deviation of the peak (solid circle) in the I–V plots at hyperpolarized membrane potentials compared with the linear portion of the I–V plot shown by the dotted line. Calibration bars: vertical 40 mV; horizontal 150 ms. (C) The late developing inward rectifying Ih current in this PN 15 Pf cell (left side) was blocked by ZD-7288 (30 μM) (right side) indicating that it represented an Ih current. Note the absence of rebound depolarizing action potentials once the Ih current had been blocked (compare left vs right arrows). Calibration bars: vertical 20 mV; horizontal 100 ms.

