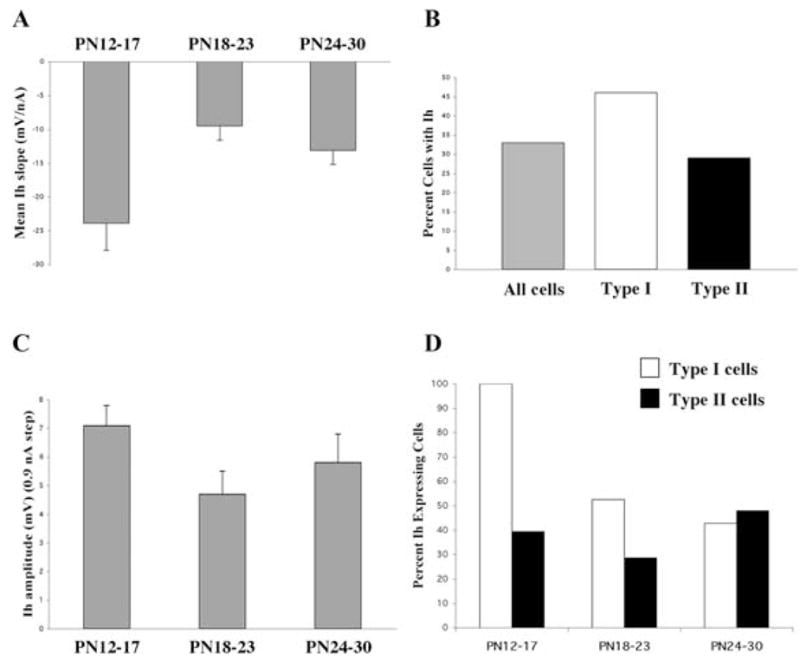
Fig. 5. Developmental changes in hyperpolarization-activated (Ih) currents in Pf cells.

(A) Mean slope of the Ih voltage deflection plotted as a function of age group (mean ±S.E.). (B) Comparison of the percent of Ih-expressing cells in the total Pf population compared with the percentage in Type I and Type II cells. (C) Maximum Ih amplitude measured in response to a 0.9 nA current step plotted as a function of age group (mean ±S.E.). (D) Percent of Type I and Type II cells expressing Ih plotted as a function of age group.
