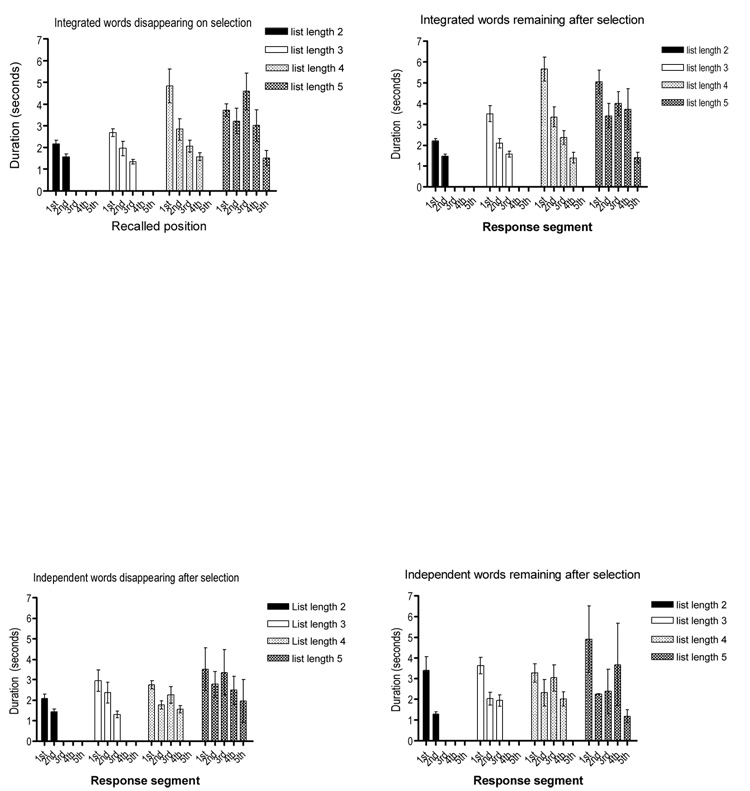
Figure 4.
Duration of recall delays between the correct selection of responses in Experiment 4, as a function of output position. Graph includes standard error bars. Top panel=data from integrated word condition (when response choices disappear after selection or remain after selection on the left and right respectively). Bottom panel=data from independent word condition (when response choices disappear after selection or remain after selection on the left and right respectively).

