
Figure 2.
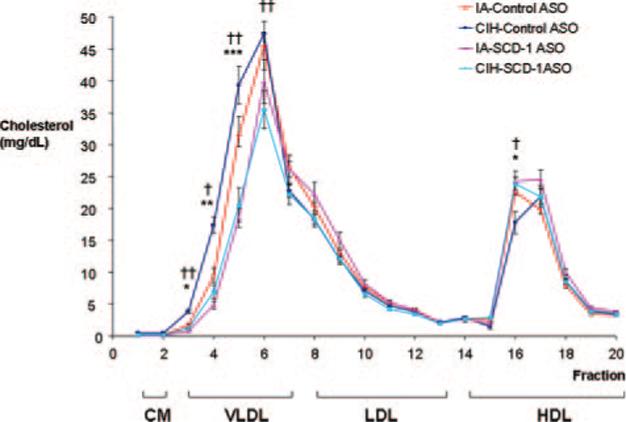
The HPLC profile of plasma cholesterol in C57BL/6J mice on a high-cholesterol diet after exposure to CIH or IA while receiving SCD-1 or control ASOs. †P<0.01, ††P<0.001 for the effect of CIH; *P<0.05, **P<0.01, ***P<0.001 for the effect of SCD-1 ASOs.