
Figure 4.
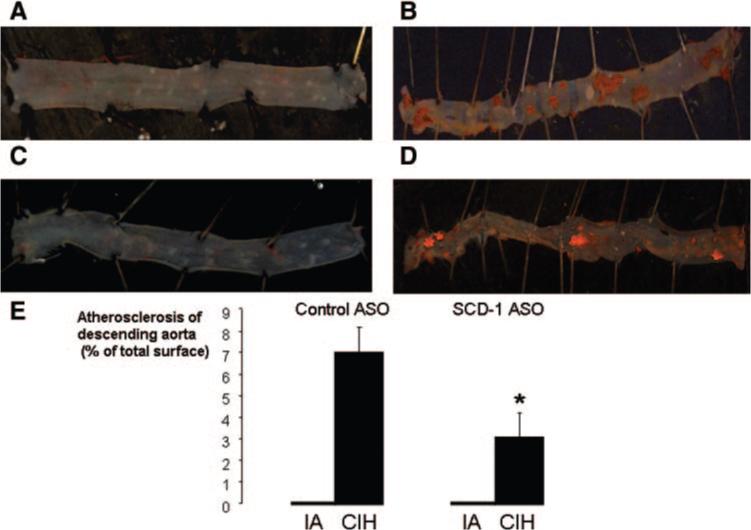
Representative images of the thoracic (aortic arch and descending aorta) and abdominal aorta by the en face method in C57BL/6J mice exposed to IA and control ASO injections (A), CIH and control ASOs (B), IA and SCD-1 ASOs (C), or CIH and SCD-1 ASOs (D); Sudan IV staining; original magnification, ×10, water immersion. E, Mean area of the total aortic surface covered by atherosclerotic lesions. *P<0.05 for the difference between control ASOs and SCD-1 ASOs.