
Figure 4. Human-specific substitution rate and proportion of AT to GC substitutions in HACNS1 and flanking genomic region.
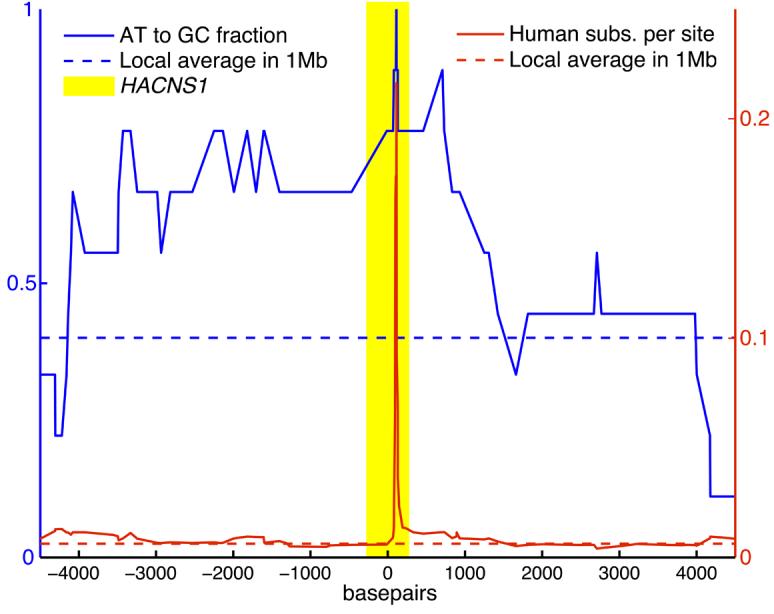
The rate of human-specific substitutions (solid red line) and the fraction of human substitutions that are AT to GC events (solid blue line) were estimated in sliding windows across a 9 kb interval around HACNS1. The average values of each metric for 1 Mb of genomic sequence centered on HACNS1 are shown for reference (dashed lines). The 546 bp interval corresponding to HACNS1 is highlighted in yellow.