
Fig. 10.
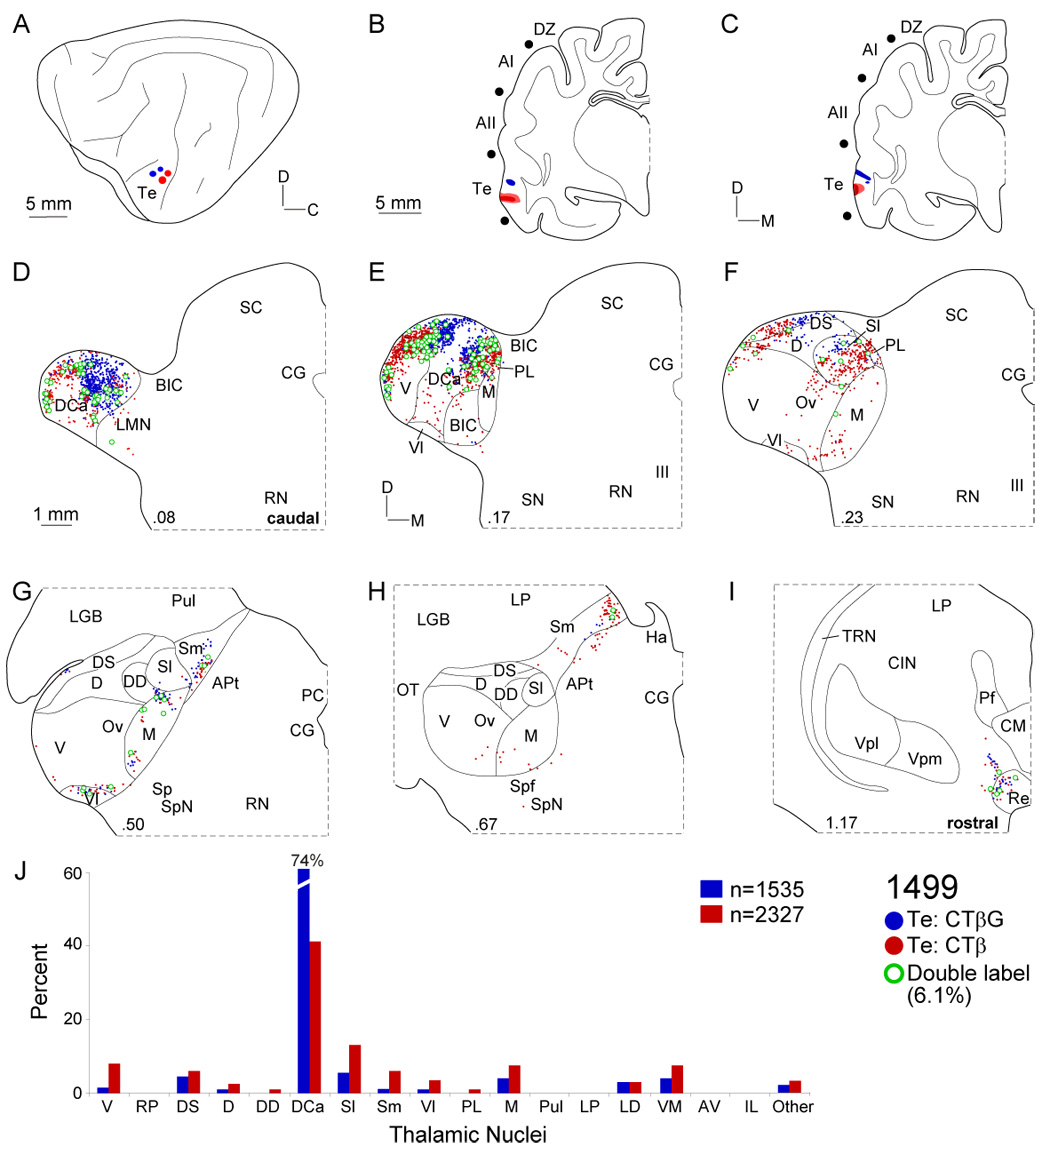
Thalamocortical projections to area Te. A: CTβG (blue circles) and CTβ (red circles) were injected ~2 mm apart. B: Two CTβ injections near the posterior ectosylvian sulcus. C: The CTβG injections were nearer the pseudosylvian sulcus. D: Te input arose from the most caudal MGB, contrasting with all other auditory cortex deposits. Labeled cells clustered in the dorsocaudal (DCa), dorsal superficial (DS), and lateral suprageniculate (Sl) nuclei, respectively. E: Inputs to the Te loci were focal. Double labeling was highest in this experiment (~6%). F: The concentrated caudal labeling declined rostrally, with small clusters in DS and Sl. G–H: Small clusters (<5%) were found rostrally, in the medial suprageniculate (Sm), ventrolateral (Vl) and medial (M) division nuclei. I: Extrathalamic input to area Te came from the reuniens (Re) nucleus. J: Te labeling was highly concentrated, with strong (>60%) dorsocaudal nucleus input, a projection second in size only to that of the ventral division input to AI.