
Fig. 4.
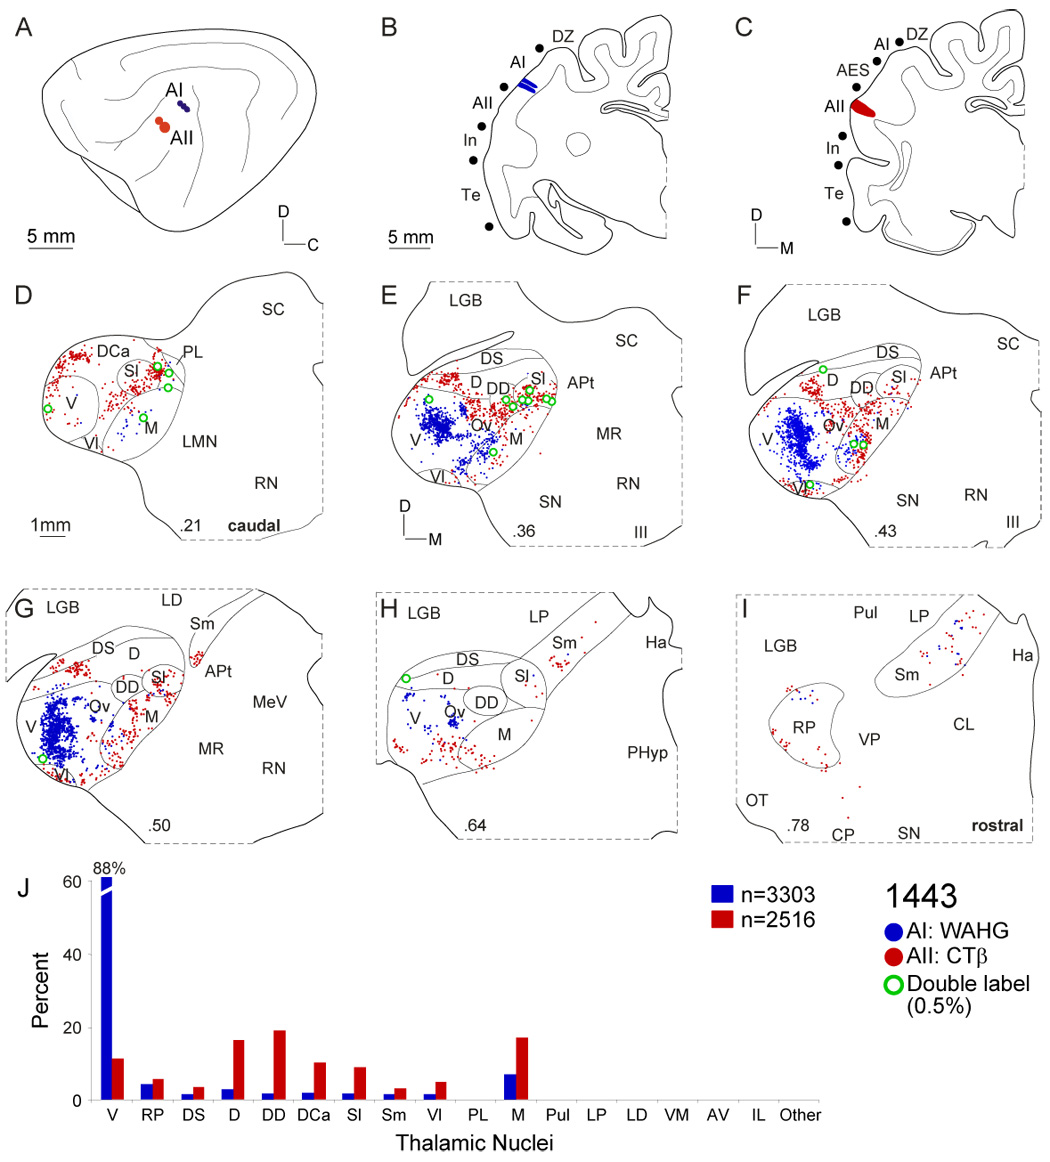
Thalamic projections to areas AI and AII. A: Lateral view of left hemisphere with three WAHG injections in AI (blue circles) and two CTβ deposits in AII (red circles). B: Coronal section through the center of injections near the ventral AI border. Deposits were <1 mm diameter. C: AII injections at the rostral border near AES. D: Thalamic input to AII (red dots) arose in more caudal regions than that to AI (blue dots). E: Both projection sets were topographically segregated. Input to AI came principally from the ventral division, and that to AII arose in various dorsal division nuclei (dorsal (D), dorsal superficial (DS) and lateral suprageniculate (Sl)). F: Thalamocortical foci of labeling to AI and AII were segregated. Medial division input was robust from the AII injection. G: The ventral division projection to AI was clustered along the dorsoventral axis. Double-labeled cells (green dots) were sparse and concentrated at the interface of the labeling. H: Beyond the MGB midpoint, only scattered labeling was present. I: Few rostral pole cells project to AI or AII. J: Contributions from each nucleus shows different AI and AII projection profiles. Most AI thalamic input arose from V, while AII received many dorsal and medial division projections.