
Fig. 6.
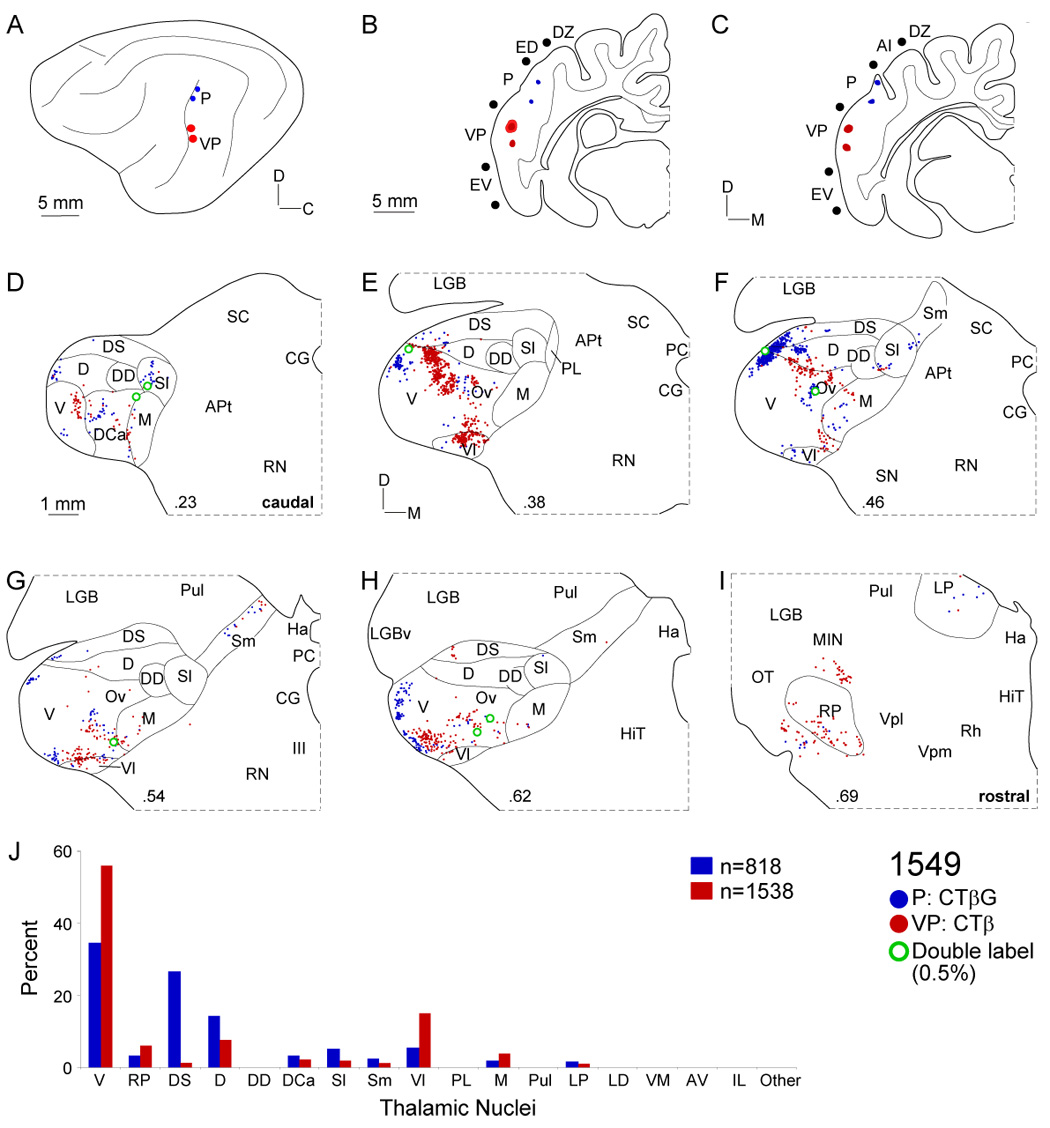
Thalamic input to areas P and VP. A: Deposits in areas P (blue circles) and VP (red circles) in the caudal posterior ectosylvian sulcus were ~5 mm apart. B: For injections along the caudal bank, the sulci were retracted. The largest VP injection (red ovals) spread <1 mm and both injections spanned the upper half of the area. C: The two area P deposits (blue ovals) were also in the upper half and each was <250 µm wide. D: Both fields had weak input from nuclei in the caudal quarter of the MGB. E: Most input to area VP (red dots) arose in the caudal ventral division as a cluster elongated dorsoventrally. F: Projections to area P (blue dots) skirted the MGB perimeter, involving ventral (V), dorsal (D), and dorsal superficial (DS) nuclei. Input to VP formed small clusters in the pars ovoidea (Ov). G: Each group of labeling was topographically segregated, despite similar origins. H: Input from the lateral edge of the MGB was also topographic, with scattered double-labeling (~0.5%). I: Small clusters of rostral pole cells project to P and VP. J: Input to P and VP had different origins in the dorsal superficial and ventral division, respectively.