
Fig. 7.
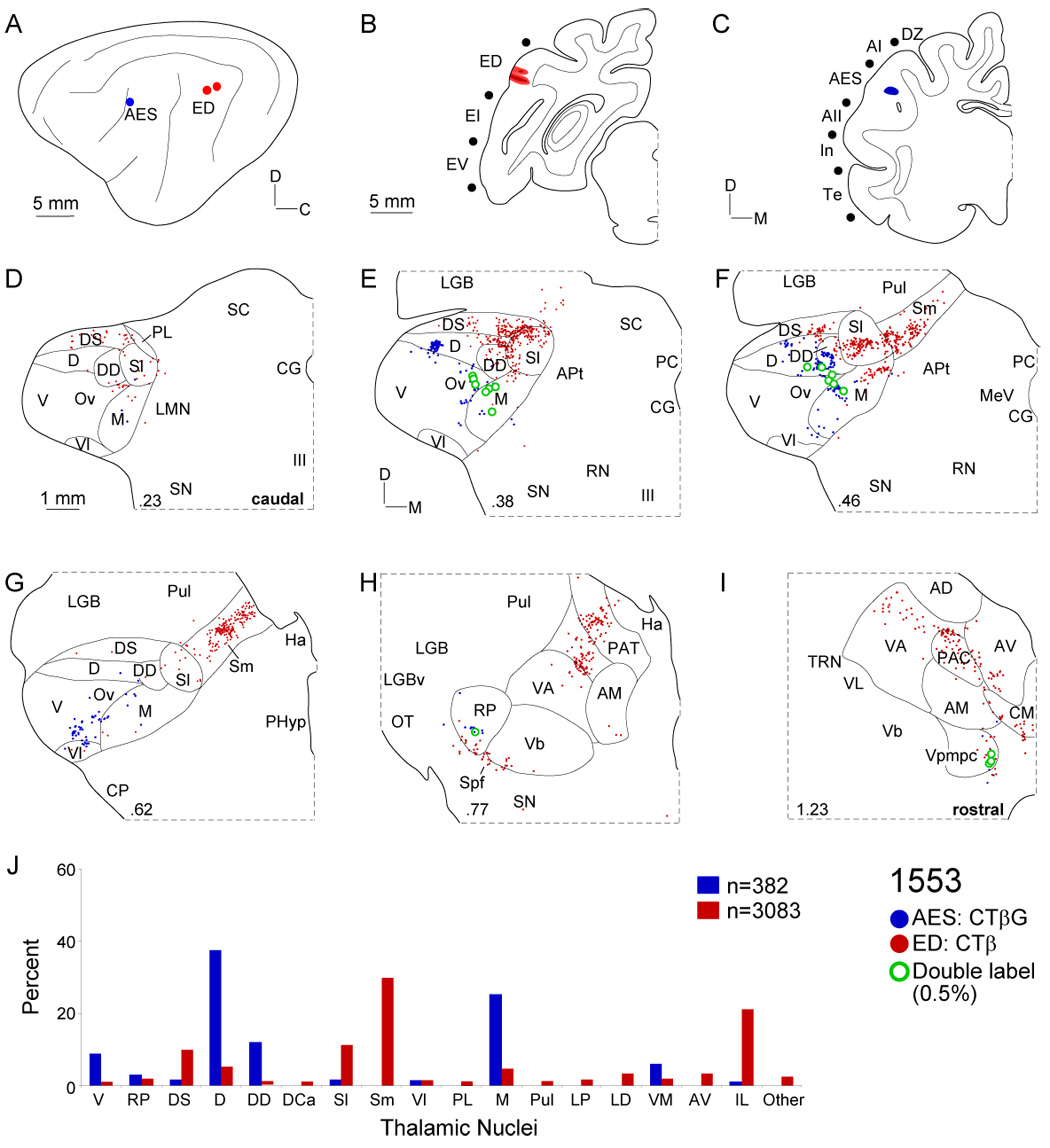
Thalamic projections to areas AES and ED. A: Deposits were ~10 mm apart in the caudal bank of the anterior ectosylvian sulcus (blue circle) and the dorsal posterior ectosylvian gyrus (red circles), respectively. B: Two ED injections each spread <1 mm. C: The AES injection were <1 mm in diameter and in the caudal bank. D: Afferents to ED arose more caudally than those to AES, and concentrated in dorsal superficial (DS) and lateral suprageniculate shell nuclei. E: AES input was topographically separate from that to ED, arising in the dorsal (D) and deep dorsal (DD) nuclei, and the medial (M) division. F: Lateral and medial suprageniculate labeling was clustered as was the main ED input (~50%). AES afferents concentrated in the deep dorsal nucleus and medial division. G: Rostrally, Sm input to ED arose as a strip extending toward the medial thalamic border, while AES projections were scattered in M and Vl, resembling AII input (Fig. 4G). H: Lesser input to both areas arose in the rostral pole (<3%) and extrageniculate sources including the ventroanterior (VA), parataenial (PAT), and ventrobasal (Vb) nuclei. I: Area ED received strong intralaminar projections (~20%) from the centromedial (CMN) and paracentral (PAC) nuclei. J: Inputs to area AES resembled those in other non-tonotopic regions (DZ, AII), arising in the dorsal and deep dorsal nuclei and the medial division, while ED received topographically segregated dorsal superficial, suprageniculate, and intralaminar nuclear afferents. Few MGB cells (<0.5%) projected to both.