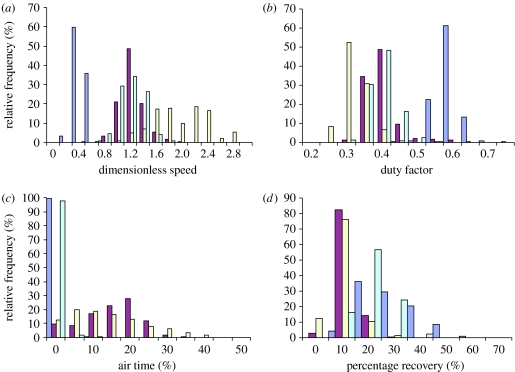
Figure 1.
Histograms for (a) dimensionless speed, (b) duty factor, (c) air time and (d) PR for all walk (light blue), trot (dark red), pace (yellow) and tölt (cyan) strides of the dataset. Relative frequency values (%) of strides falling into the categories are given for each gait to account for the varying number of strides per gait category (table 1).

